Once acquired, the county got to work distributing EagleView’s aerial imagery and data to multiple departments. Fauquier County assigned a GIS Analyst to manage the department accounts, user access, and data layers for each group. This allowed users to overlay local datasets like parcels, addressing, zoning/land use, and real estate assessment data in CONNECT over EagleView oblique and orthogonal imagery.
In fact, the first implementation of EagleView imagery within Fauquier was to support the county’s tax reassessment process for parcel re-evaluation. They were able to easily serve up locally hosted tax assessment-specific data layers as dynamic map services and upload shapefiles for unchanging data layers.
The return on investment—both financially and in increased productivity—was realized almost immediately. The county’s contracted assessors were able to leverage EagleView’s aerial imagery and data to streamline inspections for around 75% of total parcels, lowering the cost of the overall assessment contract by approximately $6 per parcel.
Shortly thereafter, the zoning and permitting staff began to leverage local data layers when reviewing site applications for compliance and accuracy, including using CONNECT’s measurement and analysis tools to determine structure setbacks and height limitations.
“Our Zoning department uses it every day to verify permit details and other information, which has been really helpful for compliance. General Services uses it to get property measurements and images remotely before going out into the field for repairs. Even our IT team uses it to manage fiber and other utilities,” said Stell.
To drive utilization, the county developed and distributed a series of internal communications, including an overview of the system and links to EagleView training, which were helpful in accelerating adoption, use, and acumen among CONNECT account holders.
Their efforts were a success. At the time of publishing, Dan’s team had onboarded 17 county departments/agencies comprising 119 internal users with more being added almost weekly. In 2022 alone, the county logged 23,077 image views, an average of 88 views per workday. Their focus on utilization helps ensure the county sees a positive return on their investment in EagleView imagery.
“When used across the county, efficiencies lead to money,” said Maybach. “The impact of the services and benefits that EagleView provides far exceeds the expense.”
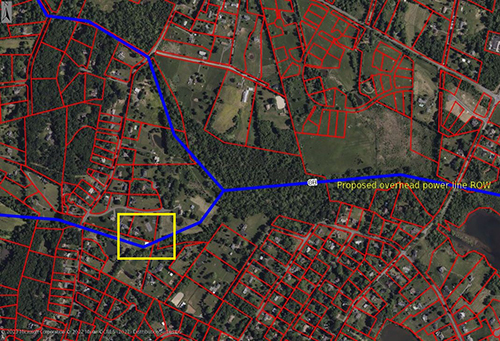
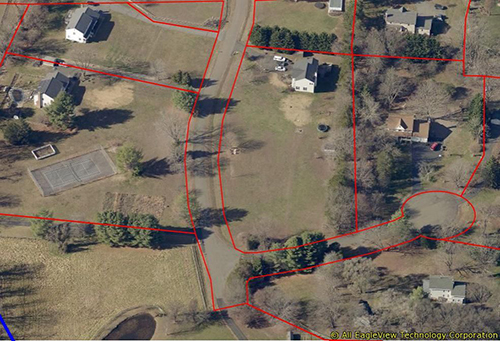 Proposed orthogonal and oblique view of utility right of way used by the county to model impact.
Additional examples of EagleView oblique and orthogonal imagery used throughout the county include:
- Emergency planning and response
- Locating utility boxes and connection points to county facilities on older structures
- Updating hydrants that were not captured from as-builts
- Updating trail and park assets
- Planning and modeling capital improvement projects
- Mapping storm and ground water features
- Locating historic structures and sites primarily used by historic African American communities*
*Per the county: “We had details and locations for many of the sites, but it was difficult at times trying to narrow down the specific portion of a structure or property that was the original part once used as schools, churches, cemeteries, and places of gathering during times of segregation and inequality. We were successful in locating or verifying the sites using the obliques alongside our GIS layers. The data has been loaded into an ESRI Story Map.”