On May 28, 2014, St. James Parish, Louisiana, declared a state of emergency due to flooding from inclement weather. It was left to government officials to help residents battle the rising waters. The preparation for this event had been years in the making.
Bobby Lear, GIS Coordinator for St. James Parish, had been working on creating an
enterprise GIS solution that would provide critical information for public safety and disaster response including the number of sand bags needed in specific locations. His department knew that what was important to residents was accurate information and resources tailored for their neighborhoods.
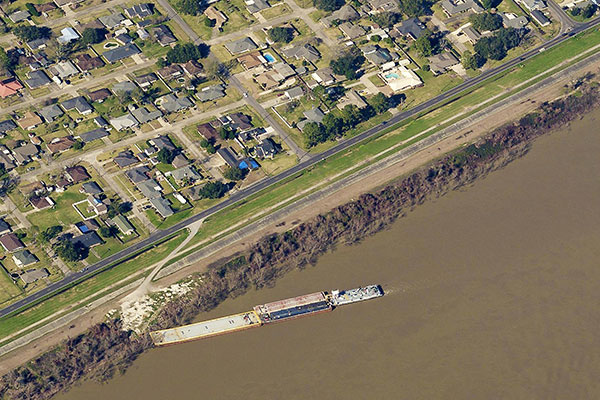
St. James Parish had invested in Pictometry aerial imagery from EagleView® Technologies in 2013 and LiDAR imagery in 2014. Using the imagery, Lear developed programs to calculate the number of sandbags needed per parcel during a flooding incident. By importing imagery and LiDAR into Global Mapper, Lear created a flood model and water level tables from three to 5.6 feet at .2 foot increments. He was able to then apply a mathematical equation utilizing linear feet and height needed for each specific water level to calculate a total number of required sand bags. When multiplied by the number of parcels served per distribution point, the parish is able to deliver the correct amount of bags for residents’ storm preparation.
“We do these types of calculations using the
LiDAR for every water level. We are able to export the data into PictometryOnline™ [now replaced by
CONNECTExplorer™], overlaying our oblique images, and also into
Esri® ArcGIS® software making the data very powerful,” stated Lear. The data and information is then printed and placed in binders for every area so even if telecommunications are shut down they have the data and maps they need for emergency response.
To show the accuracy of the application, Lear recreated models from Hurricane Isaac and applied the new calculations. “It was very accurate,” confirmed Lear. “There are several variables depending on which side of the river, direction of storms and tides but we were able to use the previous storms to validate how this would work.”
Working in conjunction with the Sheriff’s office, the GIS group has found that the same water table calculations and Pictometry imagery is a powerful tool for traffic control. “If we are trying evacuate the area, we need to know what roads could be flooded and what alternative routes would look like,” Lear said. “We have found that enterprise GIS with shared imagery is an incredibly strong tool for not only emergency response but ongoing public safety, communications and assessment. We want to put together a regional consortium that will utilize the power of this GIS information. Pictometry is key to us for that success.”