The link between public safety and geographic information systems (GIS) is clear in
E9-1-1 dispatch centers. Dispatchers rely on maps to send the appropriate personnel to an emergency. Law enforcement personnel also take advantage of GIS to create public safety incident maps.
Incident maps help public safety agencies track and categorize crimes, traffic accidents, and other events in their jurisdictions. Many civilians are familiar with traffic incident maps originating from E9-1-1 calls and might check them to know which streets to avoid during a commute.
Crime maps are another common example of a public safety incident map. Some of these maps are public-facing to notify community members of incidents that have occurred in their neighborhoods.
Police departments also use these maps internally during investigations. They may look for connections between criminal acts, such as a string of thefts in the same neighborhood. From there, they might use that data to predict future crimes and develop appropriate response tactics.
Creating a public safety incident map
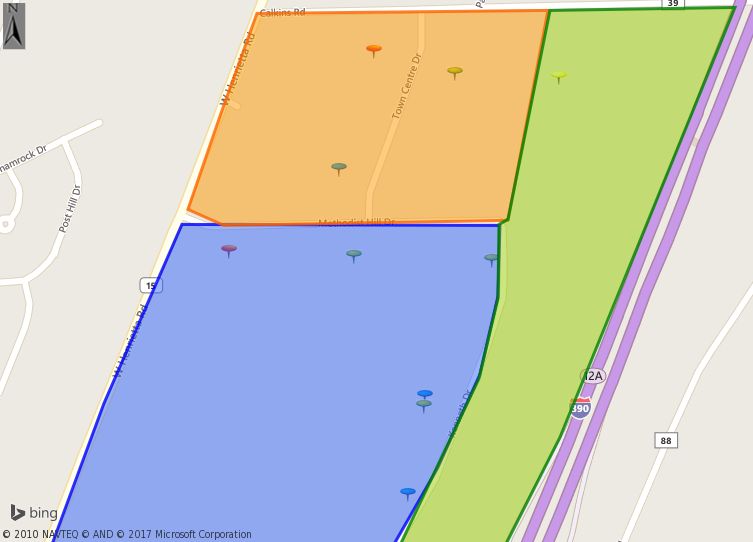
An example of an incident map without imagery created in CONNECTExplorer™
Incident maps must update consistently with information on incident type, time, and other criteria. They often mark locations with specific icons to denote the type of event. For instance, a jurisdiction may simply use one type of icon for theft, or they may use several colors to indicate the type of theft that has taken place (e.g. burglary, robbery, larceny, or shoplifting).
When users click on these points in the map, they can see details pertaining to that incident. The status of the case, weapons used, and the type of location (residential, commercial building, street, etc.) are usually of public interest. However, public-facing crime maps may hide some details for privacy reasons. A map internal to the agency, however, might give further details on the perpetrators, victims, arrests made, incident numbers, and other data.
Maps using GIS data also give the user the ability to add layers, such as shapefiles denoting boundaries for different districts, parcels, or other local information. This strategy benefits larger departments that split personnel into zones or beats.
Incorporating aerial imagery with GIS data
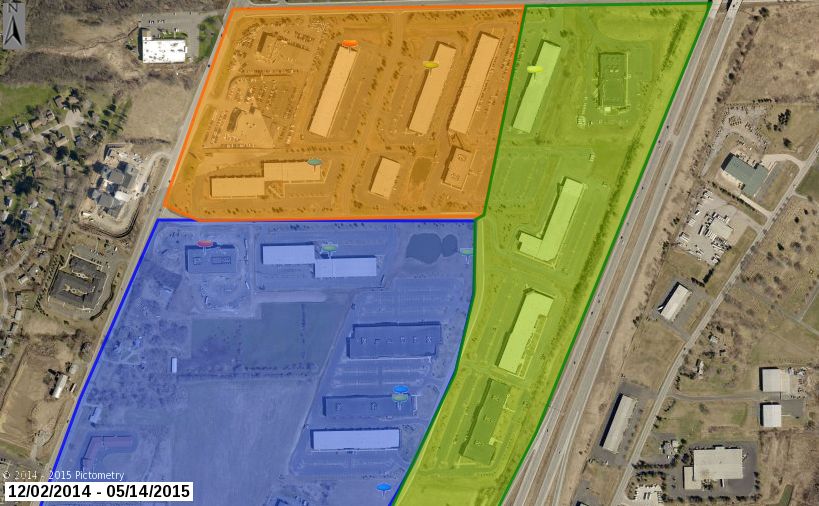
An example of an incident map with Pictometry orthogonal imagery created in CONNECTExplorer
A public safety incident map can give basic data about where and when crimes have taken place. However, agencies may need greater location information about areas with a higher-than-average number of incidents. For this, they might turn to aerial imagery.
Aerial imagery from
an oblique perspective offers a realistic view of a location and aids intelligence-led policing. Officers might use imagery when planning a raid or deciding where to install video equipment to monitor an area. Public safety communicators also use aerial imagery to let dispatched personnel know of any
potential hazards at the scene.
Public safety personnel can view orthogonal and oblique Pictometry® imagery from EagleView® in
the CONNECT™ platform. The platform gives users the ability to create workspaces to save datasets and view GIS data alongside real-world imagery captured at low altitudes. Pictometry imagery also
integrates with Esri ArcGIS Solutions Suite, including ArcGIS Pro, and other applications, so departments can have access to imagery and data all in one program.