 Updated February 2019
While no jurisdiction ever wants a disaster to occur, anticipating the risks of a flood, hurricane, tornado, or other event can help reduce damage and potentially save lives. Emergency managers, assessors, GIS professionals, public safety leaders, homeland security agencies, and other disaster relief providers use Pictometry® imagery from EagleView to see the changes before and after an event.
Jurisdictions that fly with EagleView are eligible for
Access Technology™ imagery in the hours or days following certain disasters. This option allows jurisdictions to receive post-event imagery to begin the emergency management process as soon as possible. When used side-by-side with pre-event imagery and add-ons like
ChangeFinder™ data, agencies are able to spot changes and know where resources are most needed.
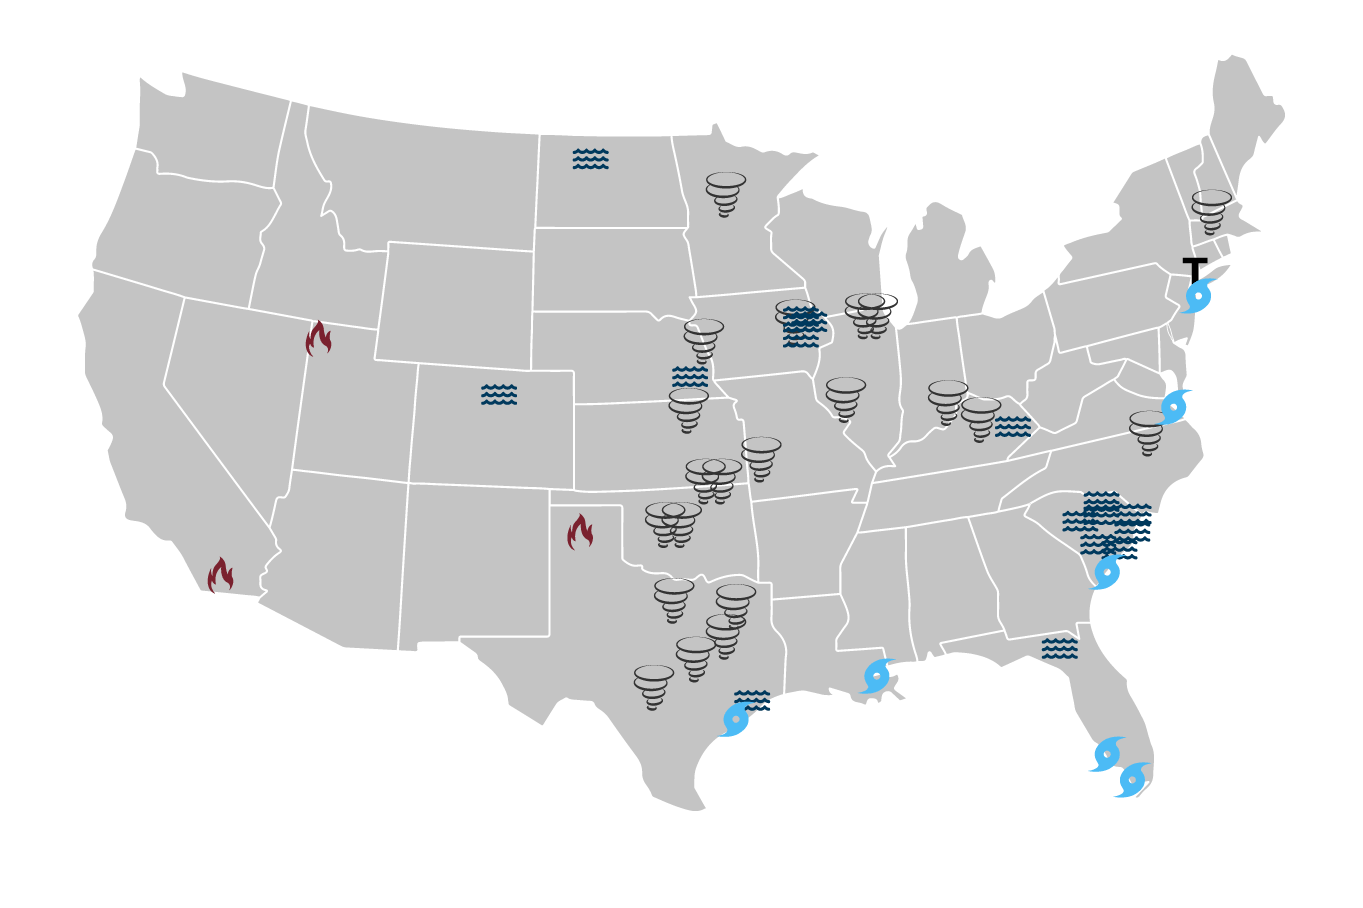
How many events have we flown? As many as 50 locations have received post-event Pictometry aerial imagery as of January 2018. Keep reading to learn about where Pictometry imagery has made a difference after catastrophic events, and scroll down to see our interactive map.
Hurricanes

Pictometry imagery was captured for five hurricanes and tropical storms, including Hurricane Katrina in 2005 and Superstorm Sandy in 2012. Both disasters ranked as the costliest and most deadly hurricanes in the United States.
In August and September 2017, EagleView
captured post-event imagery following Hurricane Harvey, which primarily affected Texas, and Hurricane Irma, which touched down in Florida and parts of the Caribbean.
Floods
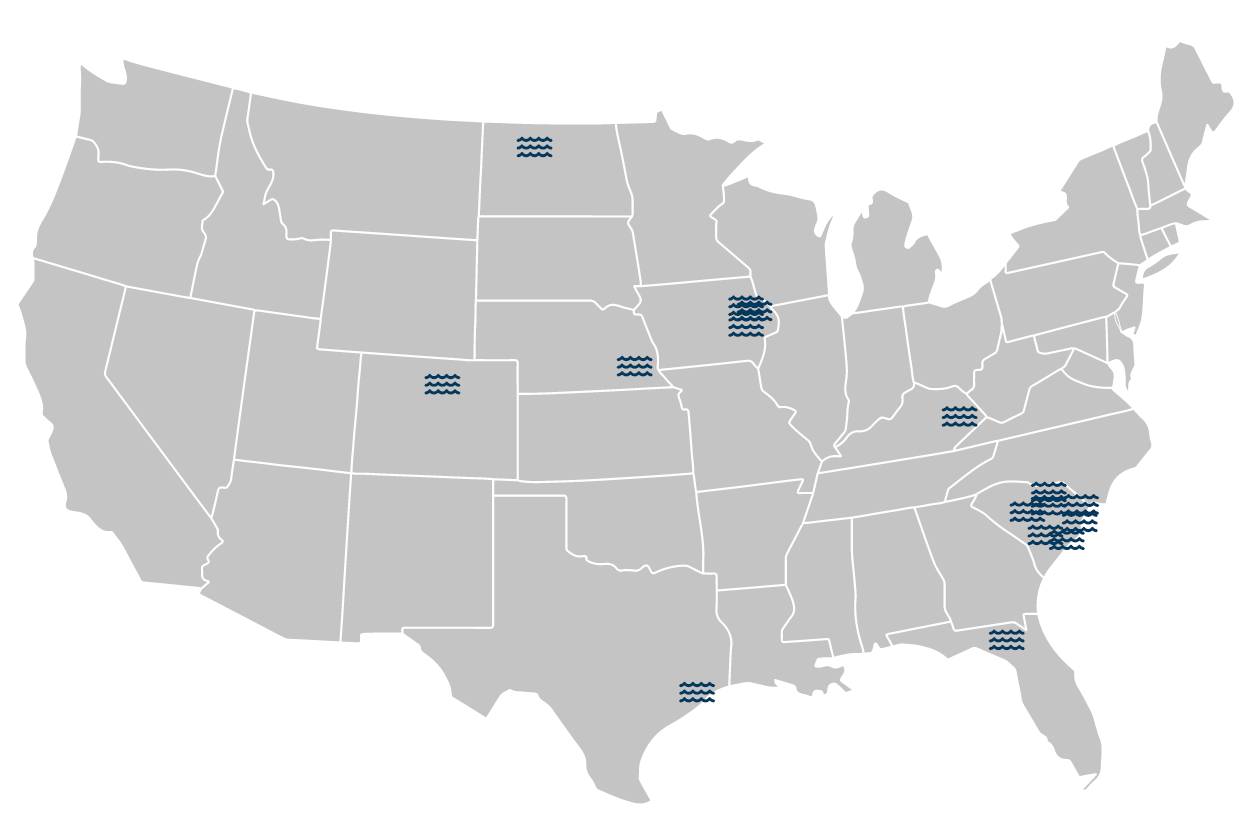
The map shows the locations of 16 flood events with post-event Pictometry imagery. The most recent occurred last autumn in Linn County, Iowa.
Federal agencies like the Federal Emergency Management Agency (FEMA) may also use the imagery in disaster recovery efforts. FEMA creates the flood hazard maps for the nation by evaluating risks in particular areas. Clear imagery and data that show the effects of a flood can help authorities better calculate flood hazards.
Terrorist attacks
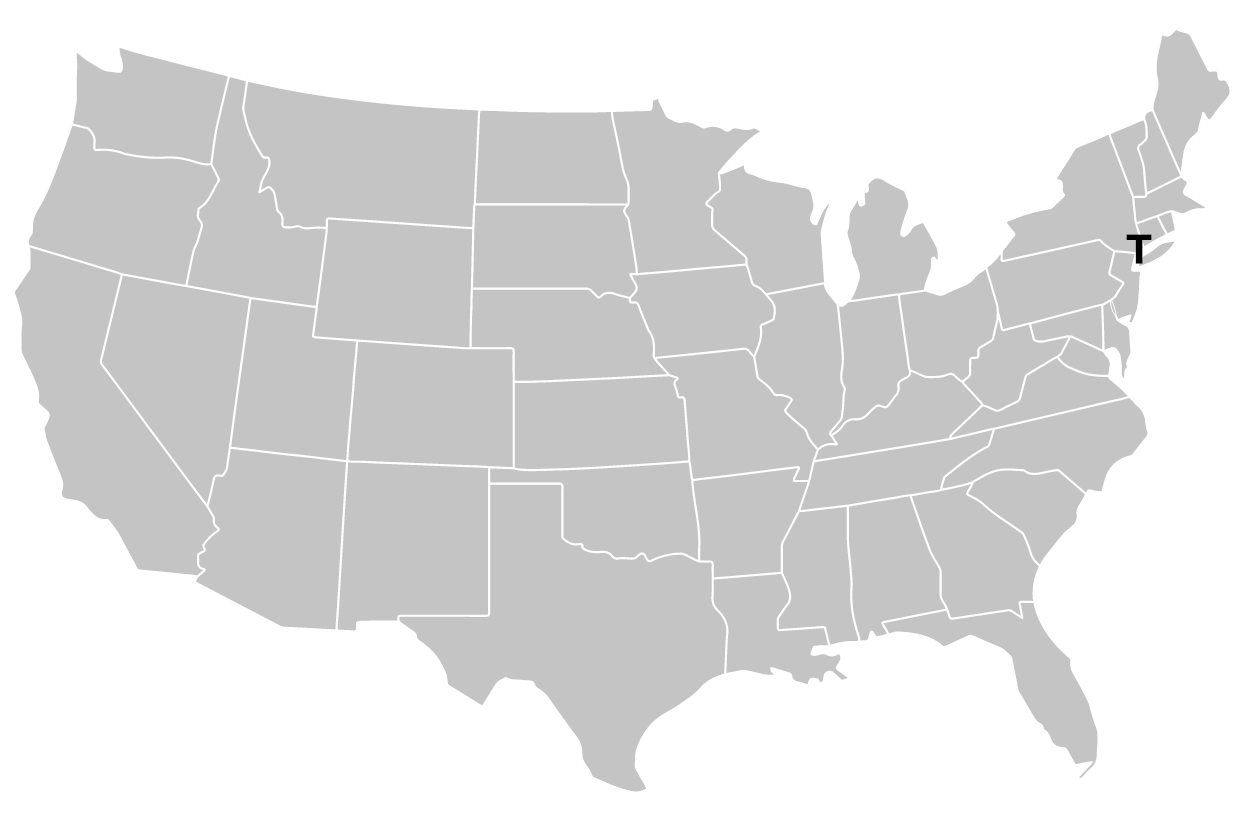
Arlington County, Virginia, was among the first Pictometry imagery customers and received the first complete library in spring 2001. The Arlington County Fire Department later used this Pictometry imagery, along with post-event imagery, following the September 11, 2001, terrorist attack on the Pentagon. Then under the name Pictometry, the company also flew Ground Zero to aid in search, rescue, and recovery efforts in New York City.
Wildfires
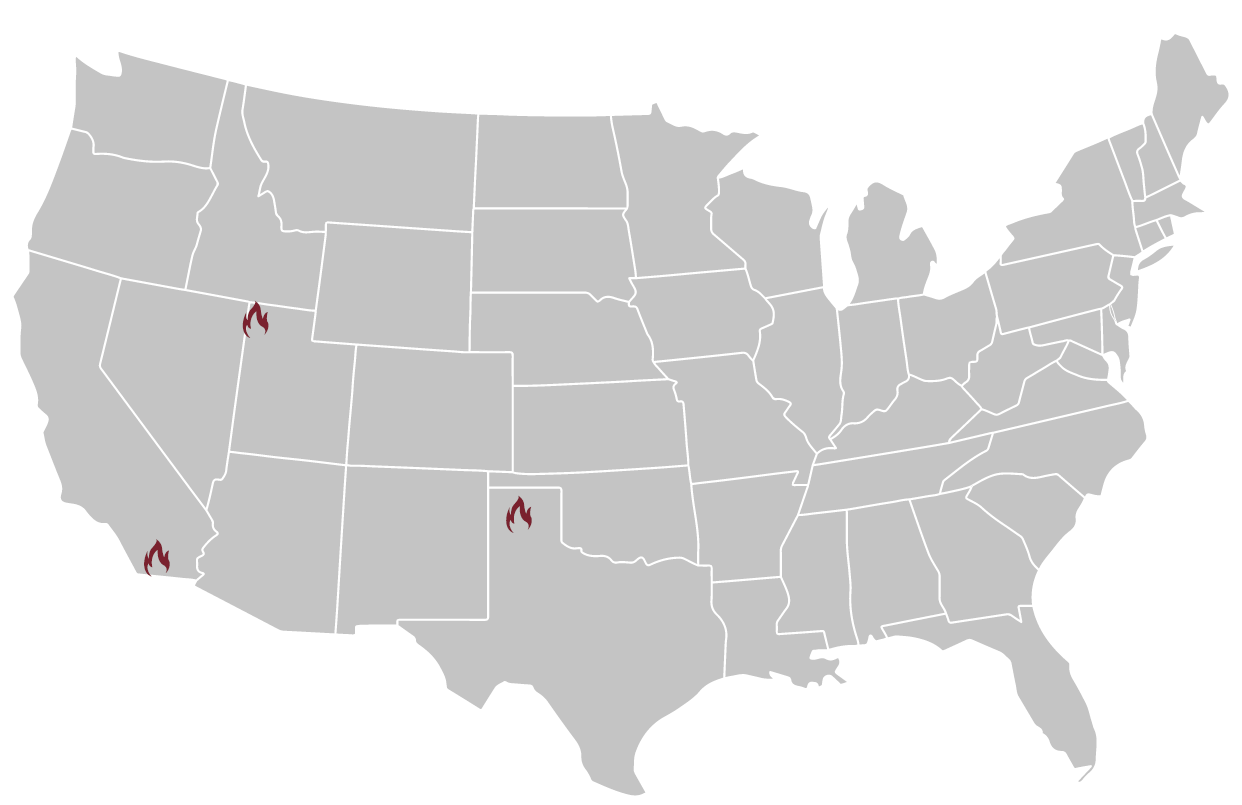
This map shows the locations of fires in the continental United States that received post-disaster imagery through Access Technology. In December 2017, the Lilac wildfire occurred in San Diego County, California. EagleView
donated imagery and its
FireAI solution to insurance carriers after the Lilac Fire.
EagleView also
provided imagery to the Regional Municipality of Wood Buffalo in Alberta, Canada, after a wildfire tore through Fort McMurray. The wildfire forced approximately 100,000 residents to evacuate the area and led to
the destruction of around 2,400 buildings in the region. Pictometry imagery played a crucial role in helping the region’s emergency management and GIS professionals lead recovery efforts for Fort McMurray.
Tornadoes
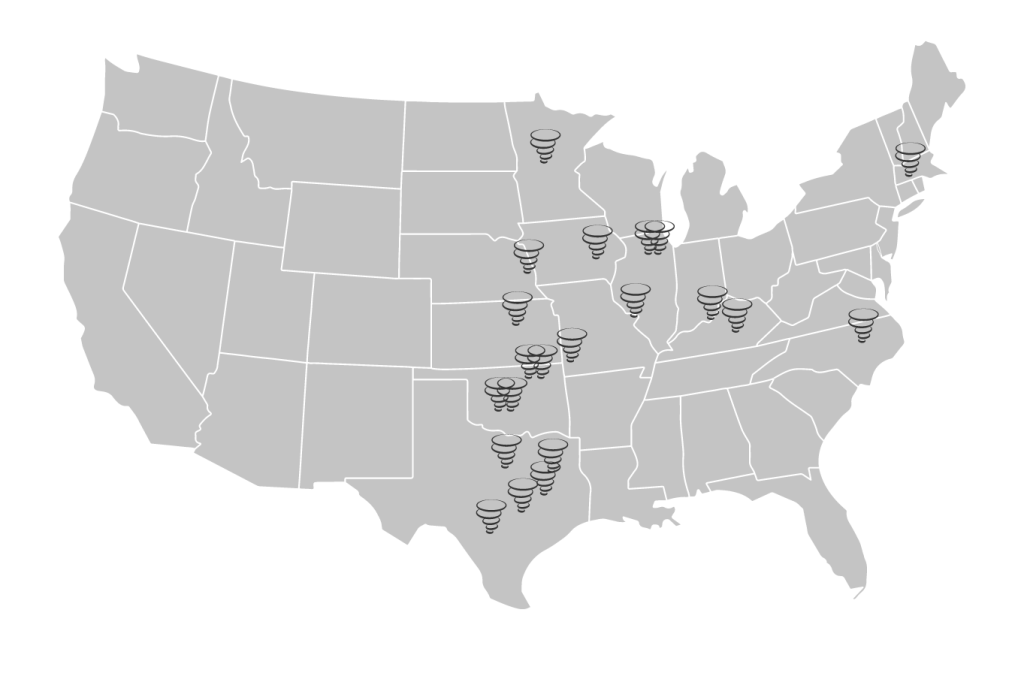
Tornadoes are some of the most common events that receive post-event Pictometry imagery, with 21 displayed on this map. One of the most severe events in recent years was the tornado that hit Joplin, Missouri, in 2011. The EF5-rated multiple-vortex tornado reached a width of one mile and took more than 1,000 lives within just a single afternoon.
More recently, we flew in the days after a tornado hit Waxahachie, Texas, in the Ellis Appraisal District. Kathy Rodrigue, Chief Appraiser for the district,
told FutureView attendees about using change detection in disaster management after the tornado. The appraisal district shared the imagery across county agencies and saw clear changes with ChangeFinder data.
All locations with post-event imagery
Explore in-depth with our interactive map. This map shows locations in the United States that experienced disasters between 2001 and 2017 and received Access Technology.
