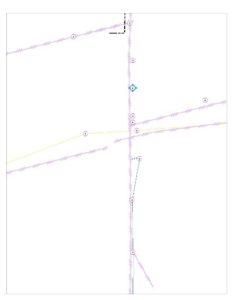
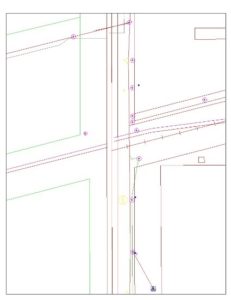
Owatonna Public Utilities (OPU) provides gas, electric and water services to Owatonna, Minnesota, a community of 25,000 people located an hour’s drive south of Minneapolis. OPU serves 11,300 electric customers, 10,000 natural gas customers and 9,300 water customers. In 2011, the electric department of OPU identified a need to update their grid schematics due to out-of-date CAD data, which had caused some safety concerns.
In light of this need, GIS Coordinator Dave Wavrin and GIS Technician Katherine Meixell suggested that a larger effort should be undertaken to convert their electric grid and map from CAD into GIS as well. Wavrin and Meixell felt that doing so would enable OPU to both update their grid schematics dynamically and as well as harness the power of GIS more broadly.
From past projects, the utility had discovered the importance of integrating EagleView imagery (formerly Pictometry) into their workflows to gain insight, data and visibility into areas not accessible via traditional methods. Before turning to imagery, the first step in the project was for OPU to convert its legacy asset drawings.
Initially, the data conversion into an Esri Geodatabase was performed by a consultant; however, due to the nature of CAD data, there was little to differentiate feature layers or how each layer is connected to real-world assets. For example, a 161Kv transmission line was represented no differently than an adjacent line on the drawing, which may in turn represent a distribution line or guywire.
Assembling the CAD data into an Esri Geodatabase offered an opportunity to unify and codify these features. With the true power of a geodatabase, topology creation allows lines to connect and a networked modeling environment to be established.
The second step to fully connect all of the assets in the model and establish a geometric network required the verification of the assets’ connectivity and location. With 103 miles of overhead primary line, 78 miles of underground primary line and a total of 150 miles of transmission line, the team had its work cut out for them. OPU chose to meet this challenge, not by making time-consuming visits to the field, but instead by examining the assets from their desktop using EagleView oblique imagery.
EagleView imagery and associated measurements tools can be accessed via CONNECTExplorer™, an easy-to-use, web-based platform for viewing and extracting data from imagery. OPU took advantage of the EagleView for ArcGIS Desktop software that enabled staff to examine multiple perspectives seamlessly from within their ArcGIS software. This software allowed them to perform a variety of analyses from their desktop, saving hours of time.
"With EagleView, we are able to verify which lines were connected to each other, and to which pole, without leaving the office," Meixell explained. "This made for a quick verification and has been a huge time sever ever since."
EagleView imagery is also utilized for verification and digitization of the transmission lines and poles that OPU maintains. Approximately 1,100 poles have been identified using digitization methods directly from EagleView imagery.
“Prior to switching to the GIS System combined with EagleView imagery, we were limited in what we were able to verify,” stated Meixell. “Using a CAD process was inefficient and the transition to GIS and imagery greatly expanded what we were able to accomplish with our resources.”


