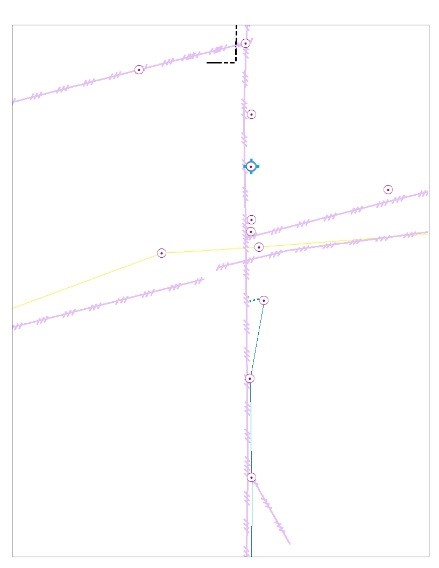
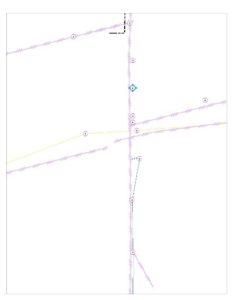
Assets in the converted Esri Geodatabase
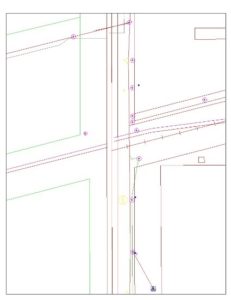
Assets in the original CAD drawings
Owatonna Public Utilities (OPU) provides gas, electric and water services to Owatonna, Minnesota, a community of 25,000 people located an hour’s drive south of Minneapolis. OPU serves 11,300 electric customers, 10,000 natural gas customers and 9,300 water customers. In 2011, the electric department of OPU identified a need to update their grid schematics due to out-of-date CAD data, which had caused some safety concerns.
In light of this need, GIS Coordinator Dave Wavrin and GIS Technician Katherine Meixell suggested that a larger effort should be undertaken to convert their electric grid and map from CAD into GIS as well. Wavrin and Meixell felt that doing so would enable OPU to both update their grid schematics dynamically and as well as harness the power of GIS more broadly.
From past projects, the utility had discovered the importance of integrating Pictometry® Intelligent Images® into their workflows to gain insight, data and visibility into areas not accessible via traditional methods. Before turning to imagery, the first step in the project was for OPU to convert its legacy asset drawings.
Learn more about the project.