Geospatial Analytics for Government: How It Works
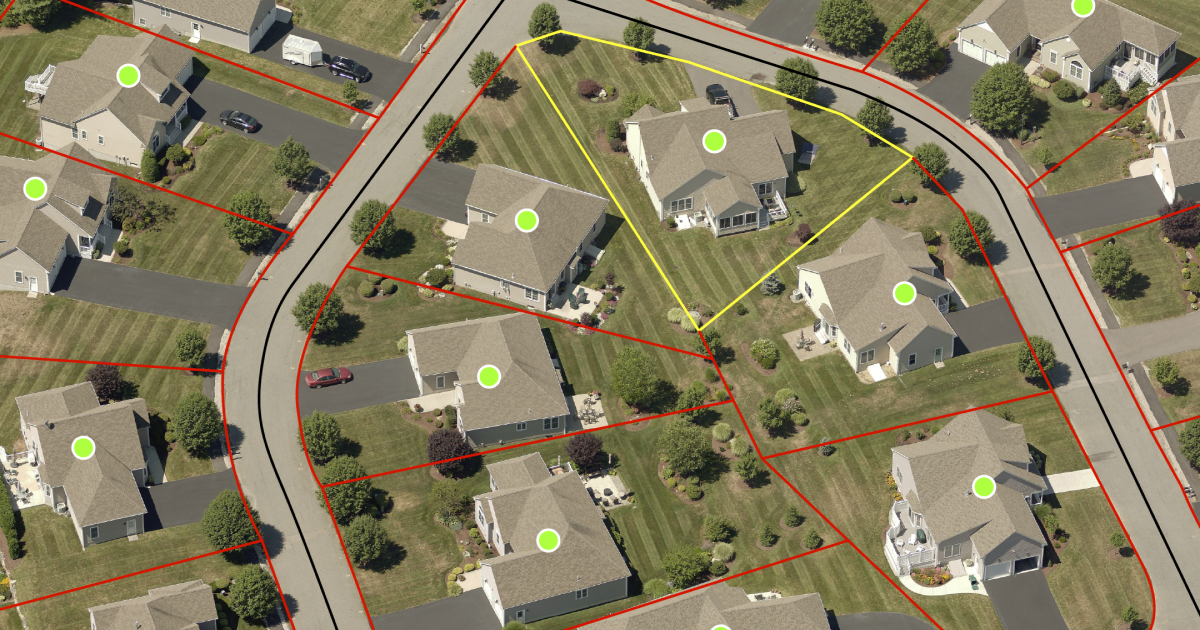
Geospatial analytics is the analysis of location, attribute, and time data to find patterns in where things are and how they change. Every record includes a location, which might be a point (like a fire hydrant), a line (like a road), or an area (like a parcel).
Add time, and analysts can see how those places change from one year, or one storm, to the next. A county assessor might compare this year's aerial imagery with last year's and find every parcel where a new structure went up.
Summary
- An analysis can't find what the imagery can't see. Ground sample distance (GSD), the width of ground one pixel covers, sets the smallest feature any analysis built on that imagery can detect.
- 1-inch pixels catch what satellite pixels blur. Eagleview captures aerial imagery at 1-inch (2.5 cm) GSD, so each pixel covers a much smaller patch of ground than a 30 cm satellite pixel.
- Sharp imagery can still be in the wrong place. Resolution shows detail, but positional accuracy decides where features land on the map. Agencies specify accuracy separately, with surveyed ground control, independent checkpoints, and a horizontal accuracy class under the American Society for Photogrammetry and Remote Sensing (ASPRS) Positional Accuracy Standards.
- "Highly accurate" is too vague to enforce. A request for proposal (RFP) that names an ASPRS horizontal accuracy class gives an agency a standard to test delivered data against.
- Some assets only show up from an angle. Hydrants and other above-ground assets are hard to pick out in straight-down imagery. Analysts find them on oblique imagery and plot them on the orthoimage, which carries the map coordinates.
What is geospatial analytics?
Geospatial analytics works on geospatial data, which describes a place and what’s there. IBM breaks it into three parts. Location information says where something is, attribute information describes what's there, and temporal information records when someone observed it. A parcel polygon with an owner, a land use code, and a capture date has all three.
Analytics starts when someone asks that data a question. An assessor might ask which parcels gained building area since the last flight. A planner might ask which homes fall within a set distance of a proposed road widening.
A geographic information system (GIS) does a different job from analytics. A GIS stores, edits, and maps layers such as parcels, roads, and utility networks. Analytics draws on those layers, often in the same software, to measure patterns and change. ThoughtSpot makes a similar split between storing location data and learning something from it.
What are the types of geospatial data?
Geospatial analytics works with three kinds of data. Vector data stores features as shapes. Raster data splits the ground into a grid. Temporal data records when each observation happened.
Vector data
Vector data represents features as points, lines, and polygons. A hydrant is a point, a water main is a line, and a parcel is a polygon. Each feature also carries attributes, such as a parcel's owner or a hydrant's installation date. Because vector features hold exact coordinates, analysts can measure the distance from a hydrant to a structure or the area of a parcel.
Raster data from satellite and aerial imagery
Raster data divides the ground into a grid of cells, or pixels, each with a stored value. IBM lists satellite imagery as a common form of geospatial data. Aerial imagery uses the same grid.
An orthoimage is aerial imagery corrected to a uniform scale so it lines up with the map. Analysts join many orthoimages to create an orthomosaic, which they use as a basemap and to trace new features. Ground sample distance (GSD) is the width of ground one pixel covers, and it sets the smallest feature the grid can show.
Temporal and real-time data
Temporal data attaches a time to each observation. Two captures of the same block a year apart show new structures, removed sheds, and expanded pavement. Real-time feeds, such as vehicle global positioning system (GPS) tracks and sensor readings, update continuously. Imagery only shows change as often as a plane flies over.
What are the benefits of geospatial analytics?
Put parcels, permits, and current imagery in one view, and some fieldwork moves to the desk. An assessor can confirm a new garage, or a planner can check a setback, without a site visit. ThoughtSpot lists faster decisions, operational efficiency, and risk management as key benefits of geospatial analytics.
Regular captures keep the map current. A new subdivision or widened road appears in the next flight without anyone reporting it, and comparing flights shows what changed.
The benefit most specific to government is accuracy an agency can put in writing. When imagery carries a stated positional accuracy class backed by documented testing, a GIS director can write that class into an RFP and test the delivered data against it.
None of this works if the data is wrong. An outdated or offset layer still produces a clean-looking map, and nothing on the map warns the reader.
Geospatial analytics applications across industries and government
Any decision that depends on location can use geospatial analytics. In IBM's examples, insurers project policyholder risk, utilities predict service disruptions, and incident commanders map wildfire growth. ThoughtSpot points to territory design and customer growth as common commercial uses.
GIS, assessment, public safety, and public works teams all use the same imagery, but each team needs different GIS mapping and property data.
Government GIS basemaps and parcel accuracy
GIS departments keep basemaps current by recapturing imagery and redrawing what changed. According to our imagery accuracy statement, features digitized from imagery carry the imagery's positional error plus small errors from the digitizing itself. If nobody knows the basemap's offset, nobody knows the error in any layer traced from it.
Parcel layers show how often that check is missing. In the National States Geographic Information Council's (NSGIC) 2025 Geospatial Maturity Assessment, only 54% of states with parcel programs reported following a standard that included verification and quality assurance and quality control (QA/QC).
We produce our Certified Orthomosaics with surveyed ground control and assign them an ASPRS horizontal accuracy class. That class is a published figure, in centimeters, for how far mapped features can be from their true positions. Analysts who edit parcels or edge of pavement on these orthomosaics start from a known accuracy.
Property assessment aligned with IAAO recommendations
Assessors use imagery to review parcels from the office, looking for new structures, additions, and demolitions between field visits. Comparing two captures shows what changed, so field time goes to the properties that need it.
The International Association of Assessing Officers (IAAO) sets out mass appraisal practice in its Standard on Mass Appraisal of Real Property. Our aerial imagery for property assessment meets IAAO's recommendations for using aerial photography in mass appraisal. Our sketch verification tools also compare imagery with computer-assisted mass appraisal (CAMA) records to find missing or inaccurate property sketches.
Public safety and disaster response
Dispatchers and responders need recent imagery that shows a building from multiple angles. Oblique imagery is taken at an angle, so it shows entrances, stories, and fences that a straight-down view hides. Crews use it to plan how to reach a specific address.
Imagery captured before a storm can't show which roads the storm closed. Post-event capture gives teams a current map after a flood, tornado, or wildfire, and comparing before and after helps them decide which roads and inspections come first. Our Disaster Response Program provides eligible government customers with post-event imagery after qualifying catastrophic events.
Public works asset inventory and verification
When a public works layer is missing assets, or has them in the wrong spot, a team can fix it from the office. Hydrants are hard to spot from straight above, so analysts find them on 1-inch oblique imagery. They then plot each one on the orthoimage, which carries the map coordinates.
When analysts plot hydrants on a Certified Orthomosaic, every point carries the orthomosaic's stated ASPRS accuracy class. Our aerial imagery for public works lets teams mark an XY coordinate for each asset, and our Cityworks integration puts oblique imagery inside the asset management platform crews already use.
Test each asset class against known field locations before relying on imagery for an inventory. Cleanouts and water meters are not reliably visible in orthoimagery, so verify those in the field.
Integration with existing GIS and CAD software
We deliver orthomosaics as standard web map layers that load straight into GIS software as a basemap. Eagleview Reveal subscribers can also view imagery in Eagleview Explorer or connect it to their computer-aided design (CAD), assessment, and analytics tools.
How geospatial analytics works from data capture to decision
Every analysis moves from capture to processing, analysis, display, and decision. The output is never more precise or current than the input data, so the source imagery's resolution, accuracy, and capture date limit what any software can find.
Steps in the geospatial analytics process
A geospatial analysis runs through five steps.
- Step 1: Collection. Aircraft, satellites, and drones capture imagery, GPS receivers record coordinates, and agencies add their own records such as permits and assessment rolls.
- Step 2: Processing. Technicians correct imagery and tie it to real-world coordinates, software converts addresses into map points, and analysts align layers to a common coordinate system.
- Step 3: Spatial analysis. Software measures proximity, overlays layers, finds clusters, and compares captures to detect change.
- Step 4: Visualization. Results appear as maps, dashboards, or new GIS layers.
- Step 5: Decision. An assessor, planner, dispatcher, or engineer acts on what the map shows.
Geospatial AI (GeoAI) adds machine learning to step three. Michigan State University geographer Erin Bunting describes GeoAI as AI built to understand where things happen and how places are connected. She has used it to pick up early changes in vineyard plant health. She also warns that an AI-generated map "can look authoritative even if it is built on biased data."
Analysis and mapping software handles steps three and four. Steps one and two decide how far that software can go.
Image resolution and capture method
At 30 cm GSD, each pixel covers roughly a foot of ground, so a feature only a few pixels wide blurs into its surroundings. Aircraft can also fly oblique passes. These capture building faces and heights that straight-down images miss.
We capture aerial imagery at 1-inch (2.5 cm) GSD. That's 12 times finer than 30 cm satellite imagery in each direction, or 144 times more pixels covering the same patch of ground.
Positional accuracy and ground control
Positional accuracy measures how close mapped features fall to their true locations on the ground. Buyers specify it separately from resolution because more pixels show more detail without placing features more accurately. The ASPRS standards express horizontal error as RMSEᴴ, a single number for how far features typically fall from their true position.
Ground control points are surveyed locations that tie the imagery to the ground during production. Independent checkpoints are surveyed locations kept out of production. Comparing them with the finished orthomosaic tests accuracy against points that played no part in building it.
Our Certified Orthomosaics add surveyed ground control and go through the production steps below.
| Production step | Certified Orthomosaic |
|---|---|
| Georeferencing | Surveyed ground control points |
| Production | Full photogrammetric workflow, with elevation model refinement where needed |
| Review | Intensive manual review and editing |
| Accuracy statement | Produced to meet a named ASPRS horizontal accuracy class |
| Validation | Eagleview's licensed photogrammetrists, engineers, and surveyors |
Our Standard Orthoimagery is a separate product. We georeference it directly from airborne GPS and inertial measurement unit (IMU) data, with no ground control, and rate it at 20 cm RMSEᴴ or better at 1-inch GSD. Only the Certified Orthomosaic carries the accuracy class statement, so a procurement document should name which product it requires. Any provider with proper ground control, workflow, and validation can produce a high-accuracy orthomosaic. Ask every provider for its accuracy statement and who signed it.
Imagery coverage, currency, and fitness for use
A VertiGIS session listed by NSGIC defined artificial intelligence (AI) readiness as making sure location data is "accurate, governed, traceable, and fit for use" before applying AI.
Imagery can fail that test in two ways. With no capture date, nobody can say when the pictured conditions existed. With no stated positional accuracy, nobody can say how far its features are from their true locations. Any model run on that imagery carries both gaps into every output.
Coverage and currency decide whether imagery is fit for use. Change detection needs at least two captures of the same place, and a countywide analysis needs every neighborhood captured on a known schedule. Our Eagleview Vault library holds more than 3.5 billion images and covers 96% of the U.S. population.
What to ask before choosing an imagery source
Write these requirements into the procurement document so accuracy becomes something the agency can test:
- The ground sample distance, and what any "sharper than" claim is compared against
- The ASPRS horizontal accuracy class, with the ground control method and any checkpoint results behind it
- Who reviewed and signed off on the delivered product, and their credentials
- Capture dates, recapture frequency, and coverage across the full jurisdiction
- Delivery into the GIS, CAD, and mobile tools the agency already runs
What are the challenges of geospatial analytics?
The hardest part of geospatial analytics is the source data. You can build a spatial query correctly and still get the wrong answer when the layers underneath disagree.
Every layer has some positional error. A parcel layer traced from an orthoimage and a hydrant layer collected by GPS can put the same curb corner in two different places. The reference frame adds more error. NAD 83, the official U.S. horizontal datum, is misaligned by about 2.2 meters. The National Geodetic Survey's replacement datums will change existing coordinates by as much as four meters.
Imagery also goes out of date. Each image shows the ground as it was on the day it was captured. After a hurricane, NOAA flies aerial damage assessment missions so emergency managers can compare before-and-after imagery. A basemap flown before the storm shows none of that damage.
Combining sources can lose data. A shapefile cannot store null values or field names longer than 10 characters. Exporting a geodatabase layer to a shapefile can strip attribute detail.
These errors are hard to catch without a tested accuracy statement. The federal National Standard for Spatial Data Accuracy calls for testing against at least 20 checkpoints and reporting accuracy at the 95% confidence level. Data that was never tested independently can carry only a "compiled to meet" statement. Licensed photogrammetrists, engineers, and surveyors validate Eagleview's Certified Orthomosaic. The product complies with the positional accuracy standards of the FGDC and the American Society for Photogrammetry and Remote Sensing (ASPRS).
Specify the imagery behind agency analytics
An agency sets the limits of its geospatial analysis the day it picks an imagery source, long before anyone opens a dashboard. If that imagery has no stated accuracy class, every hydrant a crew plots and every parcel an analyst edits carries an unmeasured error. The GIS team finds out when a crew can't find an asset where the map puts it.
Our 1-inch imagery shows the detail. Our Certified Orthomosaics add surveyed ground control and a stated ASPRS accuracy class, validated by our licensed photogrammetrists, engineers, and surveyors.
Talk with our government team about the resolution, accuracy class, and capture schedule a jurisdiction needs.
Frequently asked questions about geospatial analytics
What is spatial analysis?
Spatial analysis examines where things are and how they relate in space. Common methods include measuring distance, overlaying layers, finding clusters, and detecting change between dates. Geospatial analytics wraps those methods in data collection, preparation, and presentation.
What are the responsibilities of a geospatial data scientist?
A geospatial data scientist builds analyses and models on location data. The work includes cleaning spatial datasets, aligning them to a common coordinate system, writing analysis code in tools such as Python, and checking that each input is accurate and current enough for the question.
What is geospatial data processing?
Geospatial data processing prepares raw location data for analysis. Technicians correct imagery to a uniform map scale, tie it to real-world coordinates, convert addresses into map points, and clean attribute records so layers line up.
What is spatial data?
Spatial data describes a position, shape, or extent, usually as coordinates. It comes in vector form, such as points and polygons, and raster form, such as imagery grids. People often use spatial data and geospatial data interchangeably, though geospatial data refers specifically to locations on Earth.
How big is the geospatial analytics market?
Grand View Research values the global geospatial analytics market at USD 102.7 billion in 2025 and projects it will reach USD 234.0 billion by 2033. Other analyst firms publish different estimates.
